As they say, a picture represents a thousand words, Infograph is a way of representing information in a graphic way so that people can understand it very easily, to exchange messages or information very quickly, to see data pattern and relationship, and to represent a complex huge information in a simpler and easy way.
Examples of math Inforgraphs:
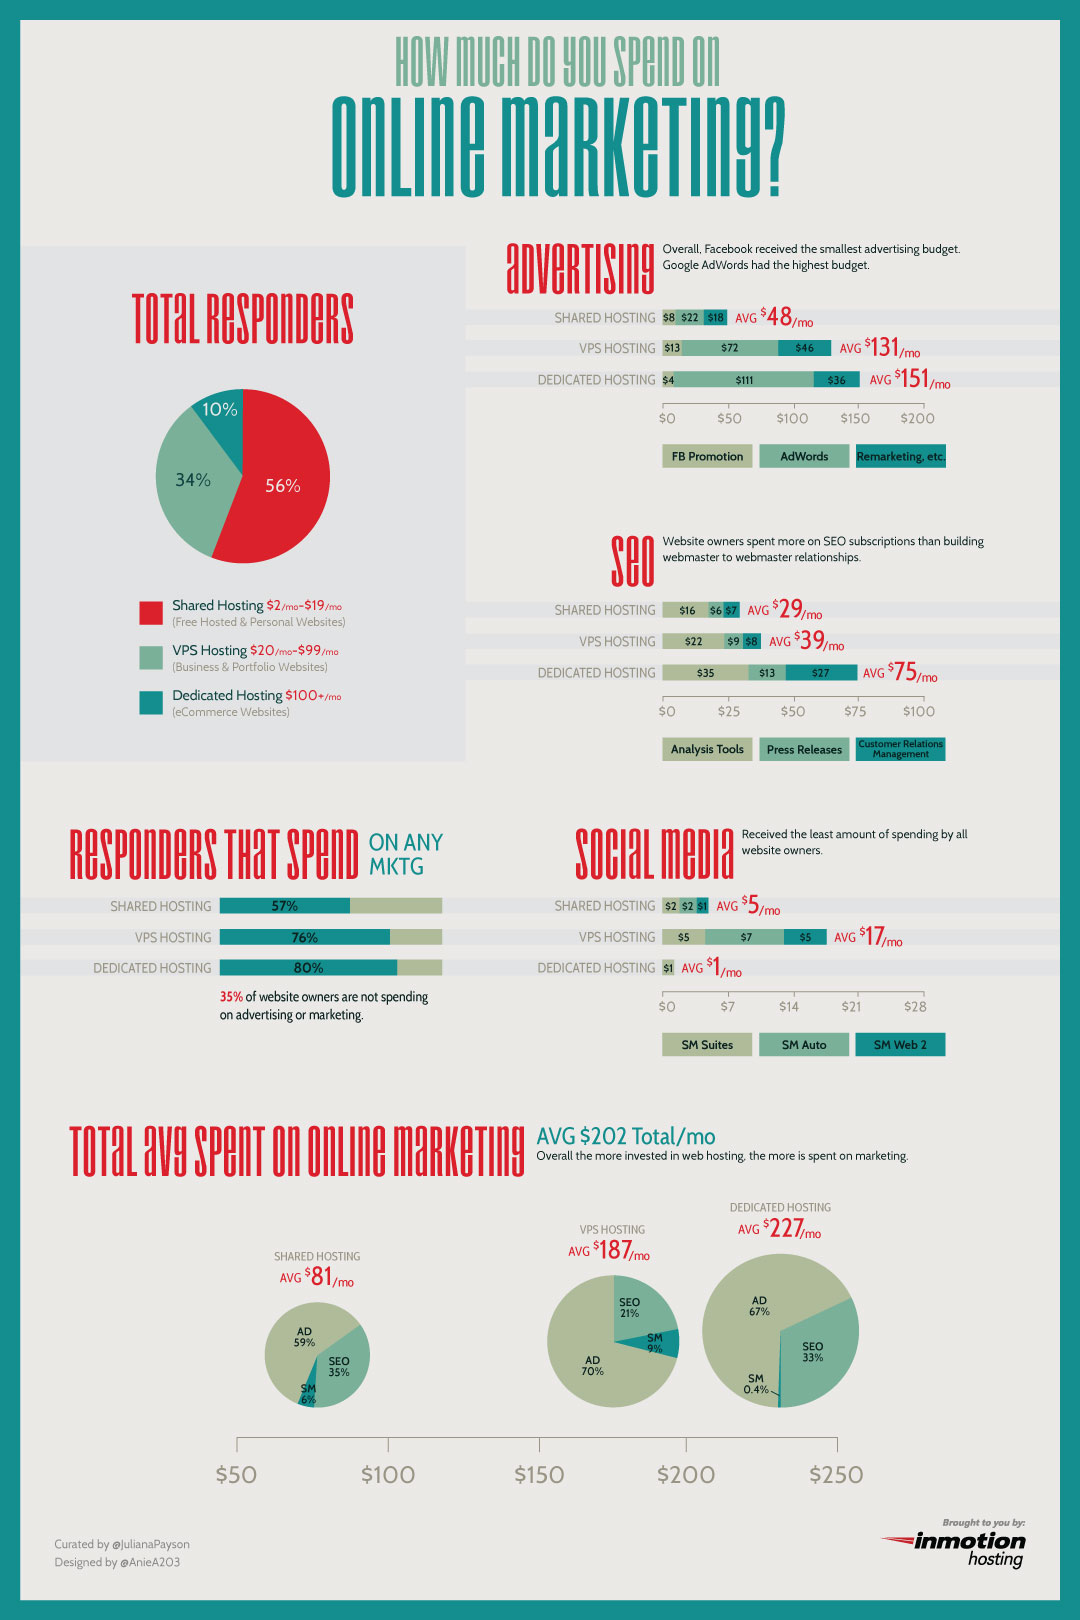
We can make our own Inforgraphs using free tools such as visual.ly, Piktochart, infogr.am, and HohliCharts. Let me share you my first Inforgraphs I created using Piktochart.

Have a good day!!
Hey Elias - this infographic would make a good project for MY math students to understand math vocabulary.
ReplyDelete